Are you using data to drive your marketing?
Do you regularly check data to confirm your market?
Are you up to speed on all the changes that are taking place today in business and big data?
Social Media’s rise has led to diminishing returns for conventional advertising. Businesses now see themselves as publishers, launching content like digital newsrooms, podcasts, AND live video. These forms of content marketing are designed to keep their brands, values, and perspectives in front of their customers 24/7.
Big Data is all around us today, and it’s the next wave in business.
WHAT IS BIG DATA?
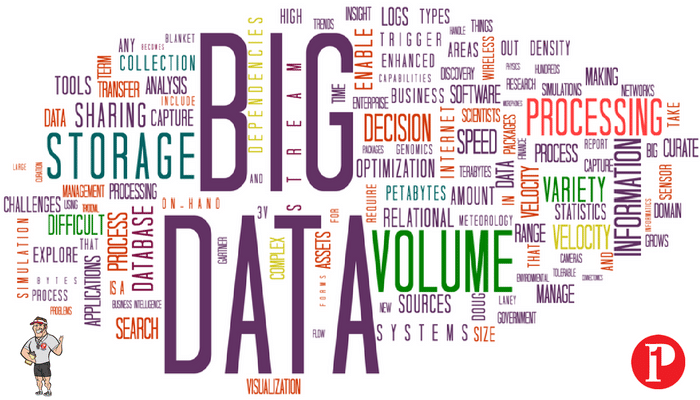
Big data is a collection of data from traditional and digital sources inside and outside your company that represents a source for ongoing discovery and analysis.
Big data is being generated by everything around us at all times. Every digital process and social media exchange produces it. Systems, sensors and mobile devices transmit it. Big data is arriving from multiple sources at an alarming velocity, volume and variety.
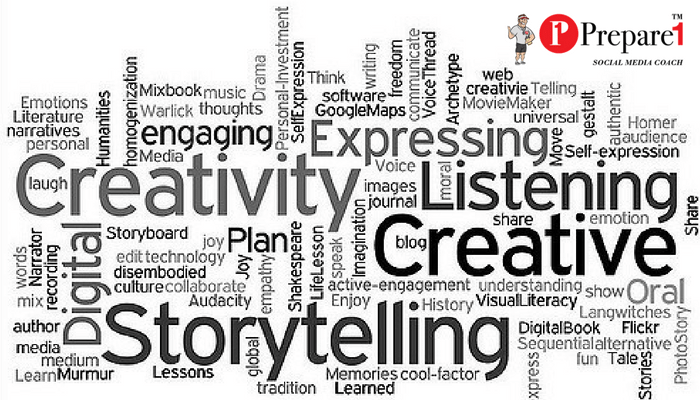
The business winners that effectively utilize big data in the marketing arena will be able to see big data as storytelling — whether it is through information graphics or other visual aids that explain it in a way that allows others to understand across sectors.
DATA JOURNALISM
What is data journalism?
What makes data journalism different to the rest of journalism? Perhaps it is the new possibilities that open up when you combine the traditional ‘nose for news’ and ability to tell a compelling story, with the sheer scale and range of digital information now available.
Just as crucial, data-driven stories attract the kind of social media attention that publishers dream about: fresh data and infographics spread across Twitter, Facebook and other social channels precisely because they are able to tell a story in a concise, compelling and visually appealing way.
Companies are now embracing their new role as content creators in charge of their own publishing. Driving Brand awareness through these social media platforms.
This still-new form of reporting draws on the growing availability of data sets and data analysis tools to uncover and tell stories like the differences in working hours across industries, often presenting the results through compelling visualizations or interactive applications.
Newspapers such as The Guardian and The New York Times have invested heavily in data journalism because they recognize that the world of big data offers opportunities to uncover new insights, and to tell stories in newly compelling ways.
DATA-DRIVEN STORYTELLING
Data storytelling is undergoing a big change — one that will influence not only data journalism but also how data is shown in the business world — and 2016 and beyond will only accelerate this trend.
The Harvard Business Review predicts that data-driven storytelling is positioned to be the next big trend in content marketing. Brands today view themselves much differently than they did in previous decades.

The goal?
To keep their brands and perspectives in front of customers, to build awareness and familiarity. They want to get attention and, moreover, they want to keep it.
Data-driven storytelling leverages the growing availability of data sets to analyze and uncover new angles on stories. But where should you start with your content strategy?
While infographics are now a standard part of the corporate communicator’s toolkit, data visualizations driven by original data are still few and far between. Look on Pinterest and you’ll see that a lot of corporate infographics are basically pretty blog posts, not data visualizations that tell an original story.
What’s ironic today’s businesses have access to more data than ever before. Unfortunately you won’t find much about turning data into blog posts or reports: you’ll mostly find marketers using data to guide their own campaigns and marketing decisions.
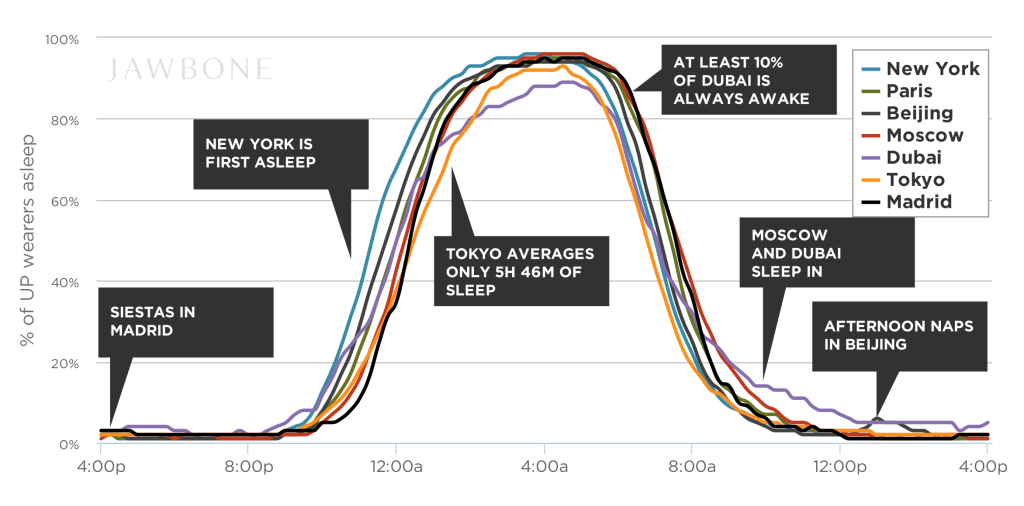
Here’s a unique exceptions to this rule with a fascinating story: Take Jawbone, which has uncovered some fascinating insights from all the folks wearing its fitness trackers – like when people in different cities wake up and go to sleep (below).
This brand recognizes that virtually every brand should be doing: opening the treasure chest of data and offering some of that wealth back to customers and the public in the form of original content.
The world has changed. First, we’re mobile. Second, social media has transformed the way we consume content. We scroll through streams and streams of content, quickly, on sites such as Twitter, Facebook and Buzzfeed. This has led to an increase in “scrollytelling“: using scrolling to reveal videos, sounds and animations which flow into and out of the story text. A great example from this year is “The Dawn Wall,” The New York Times’ piece on the astonishing 19-day free climb in Yosemite National Park in California.
These trends are affecting interactive data journalism, leading to fewer rich interactive data destinations. Does this mean data is playing less of a role in journalism? Not at all. Let’s look at the effects on data journalism.
But to reach audiences with data-driven content, what really matters is your ability to craft a good story, and there’s very little math required. In fact, discomfort with numbers may actually lead you to ask the right questions to create the most interesting and accessible data-driven content.
ALIGN YOUR STORY WITH AUDIENCE VALUES
With powerful social media reach (1 in 7 people in the world are on Facebook) and democratization of the narrative, our online activities are propelling the shared economy to give us services that came from the computer and became real.
Just like Uber or Airbnb, we’re in a world where stories don’t end with singular offline or online experiences, but instead merge and continue.
For brands, it’s important to recognize this and use the power of extension to help your audience feel more connected.
Many small businesses operate in geographic niches and don’t have the power of a McDonald’s or a Hugo Boss to create large marketing campaigns. But businesses of any size can create content around local events.
Businesses need to define a niche target group (the first believers), develop a brand communication strategy (giving consumers a simple and clear reason to believe) and create online and offline spaces for brand reach and to share stories.
WHAT ARE THE BENEFITS OF BIG DATA?
- Big Data is Timely – 60% of each workday, knowledge workers spend attempting to find and manage data.
- Big Data is Relevant – 43% of companies are dissatisfied with their tools ability to filter out irrelevant data. Something as simple as filtering customers from your web analytics can provide a ton of insight into your acquisition efforts.
- Big Data is Authoritative – 80% of organizations struggle with multiple versions of the truth depending on the source of their data. By combining multiple, vetted sources, more companies can produce highly accurate intelligence sources.
- Big Data is Actionable – Outdated or bad data results in 46% of companies making bad decisions that can cost billions.
DOING YOUR RESEARCH
Before considering how Big Data can help your content marketing strategy, it is important to first understand what problems you are trying to solve. To get to the answers, start by asking yourself some key questions, like:
- What are your overall goals for your content marketing program?
- What drives your customers and prospects when it comes to consuming and engaging with your content?
- What topics and pain points are most critical to your personas?
- What content has garnered the highest conversions?
- What about which content is driving the most awareness?
By taking a step back and figuring out what problem you are looking to solve with Big Data, you’ll be in a better position to orchestrate your content marketing strategy with a Big Data approach in mind.
Have you taken a Big Data approach to content marketing?

About Blair

Blair Evan Ball is a Social Media Coach and founder of Prepare1, a company that works with businesses, individuals and non-profits. He is a former executive with a Fortune 50 company, and his national division did $1Billion+ in sales annually.
Blair has written three e-books: Facebook for Business Made Easy, Facebook Pages for Business Made Easy, and WordPress Blog Setup Made Easy.
Blair also educates, trains entrepreneurs and business professionals how to amplify their brand, increase revenues, and raise more funds.
![[Study] How Will Businesses Change Their Social Media Activities 5 Golden Rules for Sharing on Social Media](https://www.prepare1.com/wp-content/uploads/2014/03/COACH-logohat-162x300.jpg) The Race is ON! | PREPARE | Get into the Game and WIN!
The Race is ON! | PREPARE | Get into the Game and WIN!







Comments on this entry are closed.