Facebook Insights is an analytics tool which you can use to see how people are interacting with your fan page, much like Google Analytics. It’s a powerful and free tool which is provided by Facebook to give you a better insight into your following, and with the release of the new version, it’s better than ever before.
Facebook page admins now have a new improved FacebookInsights tool for better Facebook marketing.
Admins can find this new Insights tool in the left navigation sidebar once they opt in.
- A link to the old Insights features is still found in the admin’s right sidebar
- Facebook will begin phasing out this older version of Insights on December 15th.
- Check out Facebook’s tutorial: Learn Page Insights.
Key Metrics
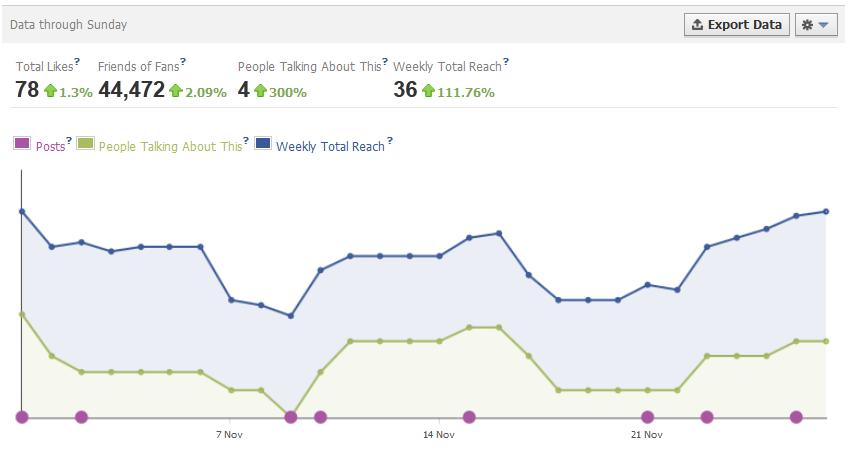
The first thing you’ll see is the four key statistics at the top of the page which covers the amount of likes you have, your reach, and how much is has changed in the past week. All of these stats have an arrow with a percentage going up or down, based on the changes in the last seven days, compared to the seven days before then.
The total likes is obvious, but the friends of fans is the amount of friends that all of your combined fans have – it’s the number of people that would potentially see a post if every one of your fans shared a link. ‘People Talking About This’ is the amount of people who have interacted with your page in the space of that week, whether it’s a comment, a like, or even a poll. Finally, ‘Weekly Total Reach’ is the amount of impressions that your posts have had – the number of times one of your posts have come up in a fan’s page.
Understanding Your Posts
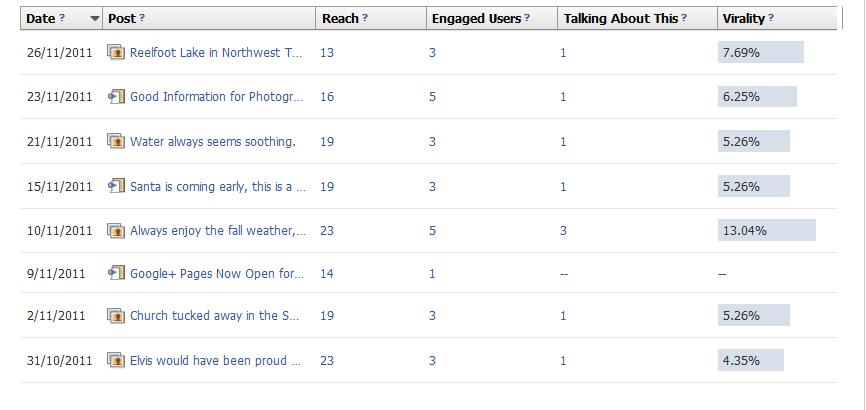
Further down the page, you’ll see all of your page posts listed in the order that you posted them, although they can be rearranged. You do have the option to change the type of pages that you want to see, such as photo, video, post, or link, but I tend to look at all of them because a month long period really isn’t that long. You’ll see from the screenshot below that besides the date, you’re also provided with information such as reach, engaged users, talking about this, and virality. The reach is the number of unique fans that have seen a particular post, engaged users (which is a lot smaller), is the number of people who have clicked on any part of your post, talking about this is the interaction (likes, shares, etc.) and the virality is just the percentage of people reached who had an interaction (talking about this). This is what it looks like.
Reach
The first thing you’ll notice is that this page looks a lot similar to the Fans section, with a bar chart of the demographics, only this time it’s sorted by your reach. I won’t go into too much detail because after the section above, it’s all fairly self explanatory, and again, you’ll see all of the location info from before as well. Even though the reach is greater than the fans, I haven’t found that my overall results have changed by any noticeable amount, in fact, I expect them to stay pretty much the same for a while now.
Where it starts to get interesting is when you scroll down to see how you reached people. You’ll see from by screenshot below that Facebook kindly breaks up all of your traffic into sections of organic, paid, viral, and total reach.
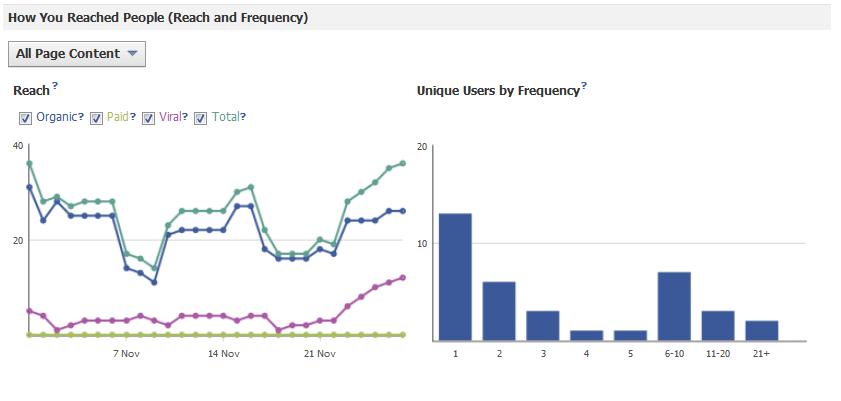 The External statistics below show where traffic is coming to arrive at your Facebook Page. So from a Social Media Marketing point of view, it is interesting to see.
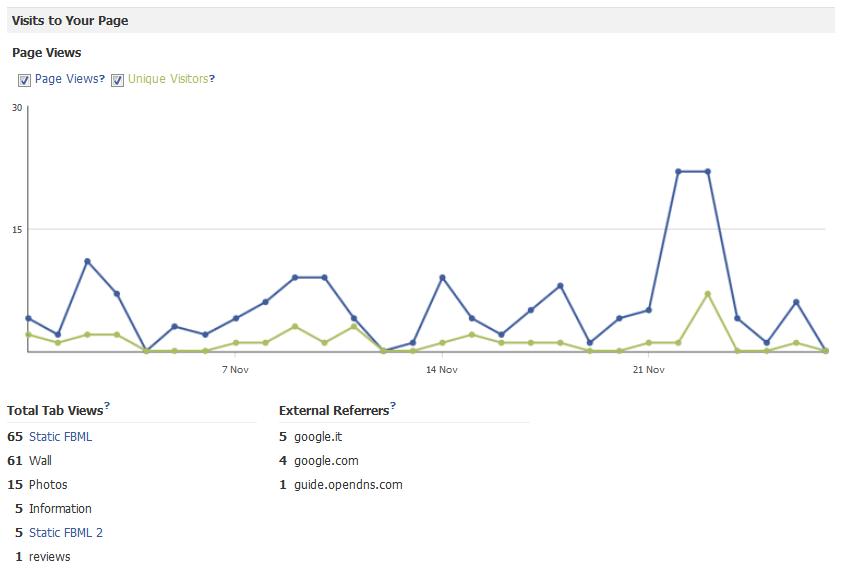 When you narrow down all the stats to a certain time range, you can see where they’ve come from and what they’re reacting to, which will help guide you in the future when you’re trying to create material that will drive traffic to your fan page. You need to have at least 25 fans in order to see insights.
Just as before, Facebook allows you to export your Insights. With the addition of these new and improved features, you can now pull a report flooded with valuable data that will provide you and/or your marketing team with key insights into the boatload of topics discussed above.



Comments on this entry are closed.