Do you advertise on Social Media for your B2B business?
If so what channels are you advertising on?
It feels like every month a social network unveils a new social media advertising tool. Facebook, Twitter, and LinkedIn have long planted their flags in this territory, while Instagram, Pinterest, and Snapchat are quickly gaining ground. This explosion in advertising options has left a lot of brands trying hard to play catch-up.
If you’re still not sure why you should put money behind your social media campaigns, we’ve gathered a long list of social media advertising stats that should help motivate you.
And then when you’re ready, read a great guide Complete Guide to Social Media Advertising to get started on your own paid ad campaigns.
SOCIAL MEDIA ADVERTISING USAGE STATISTICS
Social media advertising budgets have doubled worldwide over the past 2 years—going from $16 billion U.S. in 2014 to $31 billion in 2016
But despite this growing investment in social advertising, 46 percent of B2B marketers say they’re unsure whether their channels have generated any revenue for their business.
Social media ad spending is likely to exceed $35 billion in 2017, representing 16 percent of all digital ad spending globally
The actual number is $35.98 billion if you want to get technical. That represents an increase of almost $13 billion in just two years. Not only that, it means that social media will have maintained consistent growth (of about $6 billion every year) for nearly half a decade. Often these trends rise rapidly for a year or two and plateau. If social media advertising spend continues on this curve, there’s no telling how the industry and tools will evolve.
But that kind of spending must reflect just how expensive the ads themselves are, right? Well, actually…
Over 50 percent of B2B marketers rank social media as a ‘very’ or ‘somewhat’ low cost ad option
A survey asked 200 B2B marketers to rate the cost of demand generation channels based on the cost per lead. Just over 50 percent of the respondents ranked social media as “very low cost” or “somewhat low cost.”
B2B CONTENT MARKETING BUDGET
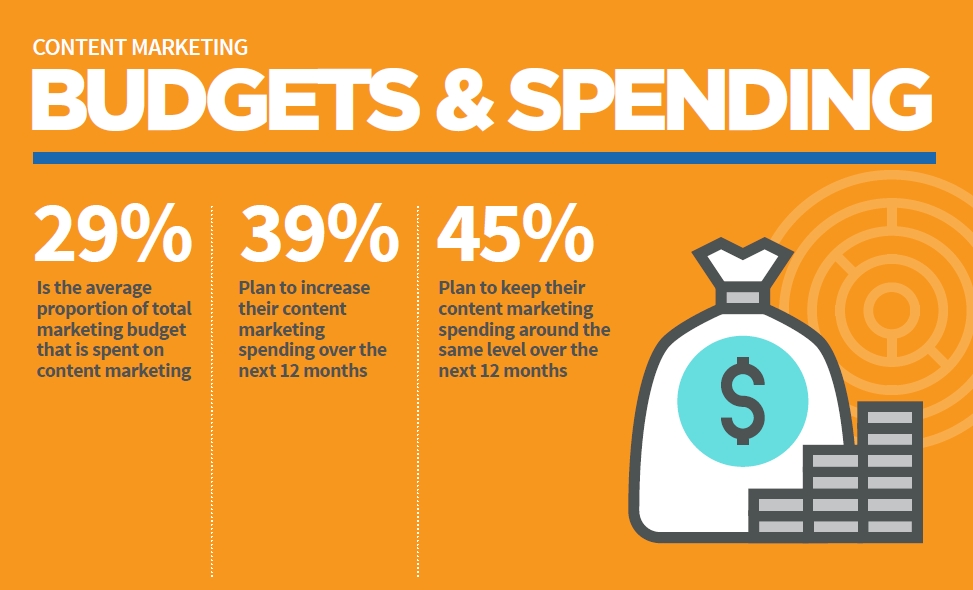
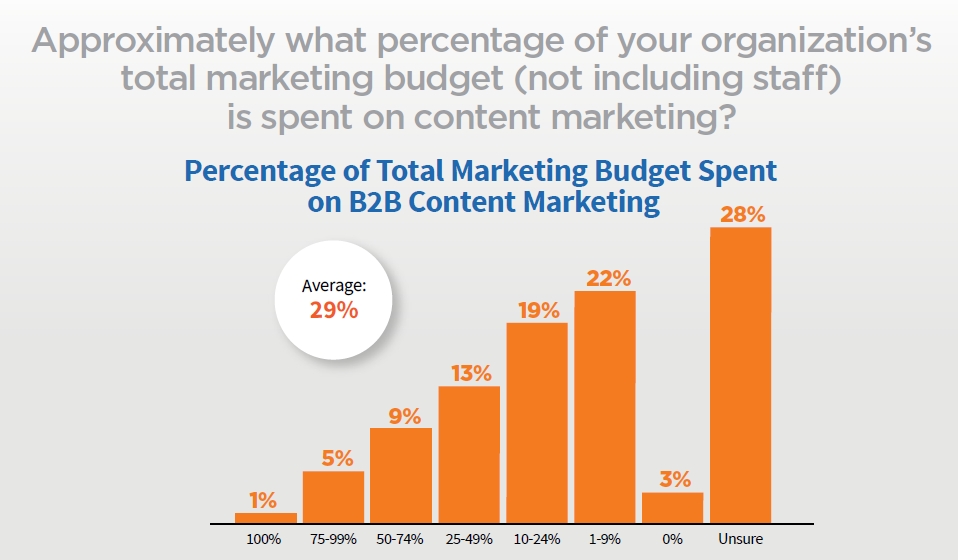
The average spent according to the Content Marketing Institute B2B study is 29%.
Over 70% percent of marketers plan to increase their use of video ads next year
This stat, from a report by Mixpo, really shows that Facebook has become the platform of choice for video advertisers. Advertisers and agencies are clearly putting their trust in Facebook for all ad types, even those where Facebook is only now starting to gain a foothold.
This trend may reverse if Facebook continues to provide inaccurate statistics to their ad users. On more than one occasion in the last year, Facebook had to admit they over inflated their numbers.
Facebook clearly played second fiddle when it comes to video advertising in the last year. But it has quickly surpassed the video powerhouse that is YouTube in terms of advertising interest.
The number of YouTube channels earning 6 figures per year is up 50% year-over-year
This is an important sign for the video network. Despite all of Facebook’s gains, those who advertise on YouTube continue to increase their spend. One would imagine that this means the ads are working, and working well.
Well enough, at least, to support an increasingly diverse array of content creators.
And who are these advertisers?
100% of the top 100 global brands have run YouTube ads in the past year
YouTube has serious respect amongst big brands. While Facebook is becoming the video advertising tool for every business, YouTube is still maintaining—and as we saw above, actually increasing—powerful relationships with the biggest brands in the world.
MARKETING SPENDING BY INDUSTRY
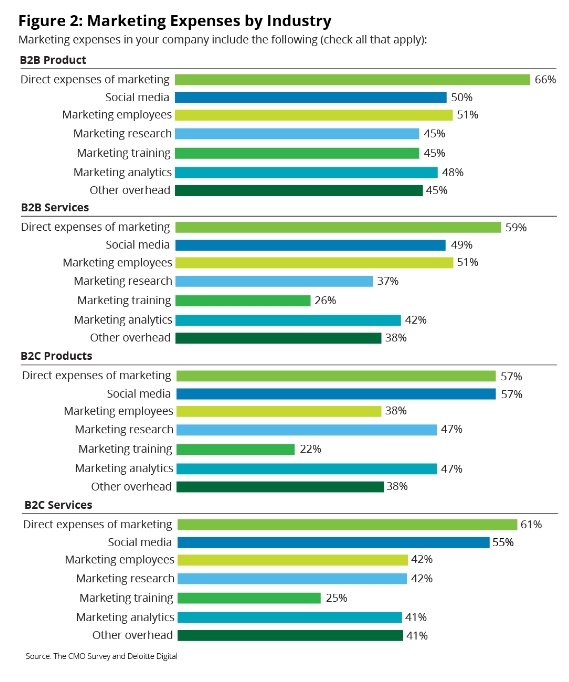
Nearly two-thirds of B2B product companies include direct expenses for marketing in their marketing budgets, while B2C product companies spend only 57 percent. This may be because B2C product companies characterize marketing expenses more broadly and integrate them into the budgets of sales or operations.
Just over half (51.4 percent) of companies include expenses for social media in their marketing budgets. This figure is higher at B2C product companies (57 percent) than at B2B product companies (50 percent), perhaps because B2B product companies spend less on social media or put social media costs in technology or corporate communications. Less than half of marketers include marketing analytics, marketing research, marketing training, and other overhead expenses in their marketing budgets.
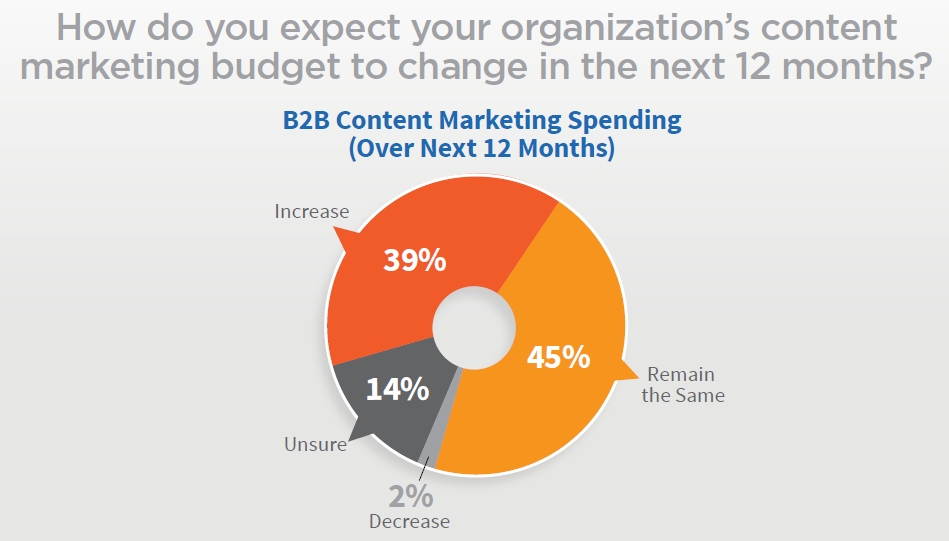
B2B BUDGET CHANGES NEXT 12 MONTHS
39% plan on increasing their budget in the next 12 months, while 45% have decided to remain the same.
METHODOLOGY/DEMOGRAPHICS
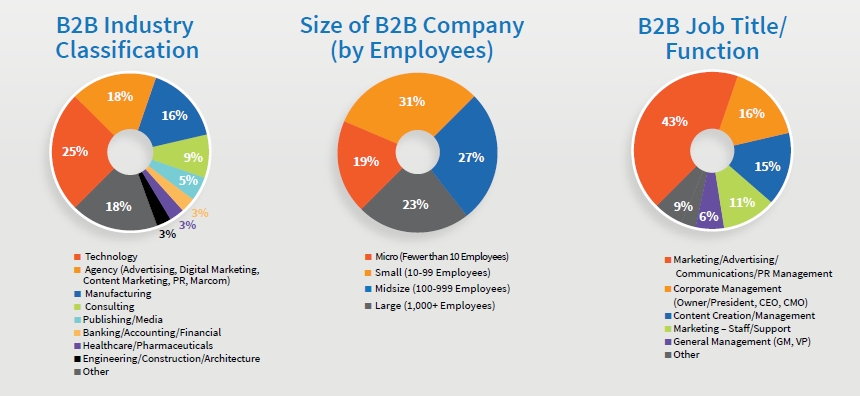
B2B Content Marketing: 2017 Benchmarks, Budgets, and Trends—North America was produced by Content Marketing Institute and MarketingProfs and sponsored by Brightcove.
The 7th Annual Content Marketing Survey, from which the results of this report were generated, was mailed electronically to a sample of marketers included in lists from Content Marketing Institute, MarketingProfs, The Association for Data-driven Marketing & Advertising (ADMA), and WTWH Media.
A total of 2,562 recipients from around the globe—representing a full range of industries, functional areas, and company sizes—completed the survey during July and August 2016. This report presents the findings from the 1,102 respondents who said they were B2B marketers in North America.
Sources: Content Marketing Institute | CMO Survey | Deloitte LLP
FINAL THOUGHTS
One of the most emotional topics in the world of B2B content marketing is budgets. How much to spend, how to allocate the budget line items.
And the topic is growing more heated as the new marketing options arise and continue to evolve. It can be overwhelming and is never resolved to everyone’s satisfaction.
It appears the greatest barrier to content marketing success is “lack of resources in staffing, budgeting or time.” Don’t misunderstand, money plays a big role, and the amount businesses are spending continues to increase year over year.
The fastest way to develop a meaningful B2B marketing budget is to tie marketing’s lead generation activities directly to revenue goals.
To start the process, marketing should do some math and work backward from sales:
1. What is your company or division’s revenue goal?
2. What is your average deal size (current revenue/current customers)?
3. How many customers do you need? (revenue goal/average deal size)?
4. What is your lead to conversion rate (current customers/current leads)?
5. Calculate the number of leads needed (customers needed/average lead to customer)
With these calculations in hand, not only can you start to dial up or down your B2B Content Marketing budget, but marketing and sales can also be better aligned.
About Blair

Blair Evan Ball is a Social Media Coach and founder of Prepare1, a company that works with businesses, individuals and non-profits. He is a former executive with a Fortune 50 company, and his national division did $1Billion+ in sales annually.
Blair has written three e-books: Facebook for Business Made Easy, Facebook Pages for Business Made Easy, and WordPress Blog Setup Made Easy.
Blair also educates, trains entrepreneurs and business professionals how to amplify their brand, increase revenues, and raise more funds.
![[Study] How Will Businesses Change Their Social Media Activities 5 Golden Rules for Sharing on Social Media](https://www.prepare1.com/wp-content/uploads/2014/03/COACH-logohat-162x300.jpg) The Race is ON! | PREPARE | Get into the Game and WIN!
The Race is ON! | PREPARE | Get into the Game and WIN!


Comments on this entry are closed.